Configuration via datasource
In addition to the configuration via the experience builders settings UI (see Configuration via Experience Builder Settings), the ncWMS widget can be configured through a so-called datasource (see ESRIs docs on adding data). You can select a Feature Layer (tabular data) and populate the widget from it’s content. The advantage of this approach is that Feature Layers can be automatically updated via ESRIs Rest API, or they can be dynamically populated by other widgets, such as the DASF Experience Builder Plugin.
Creating a compatible datasource
ESRIs experience builder distinguishes between static server-side data sources (i.e. feature layers that have been created on the server), and client-side data sources (i.e. data sources that only exist in the runtime environment of the user and are deleted once the user refreshes the page). The former is the standard case with the Experience Builder, the latter is used by the DASF Experience Builder Plugin for dynamic data creation.
Creating a compatible Feature Layer
The easiest way to create a compatible feature layer is to copy the existing ncWMS Demo Datasource.
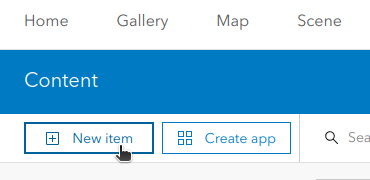
Navigate to your Content Page on the GeoHub
Click the New item button in the the upper left corner
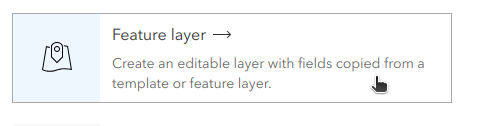
Click Feature layer to create a new feature layer
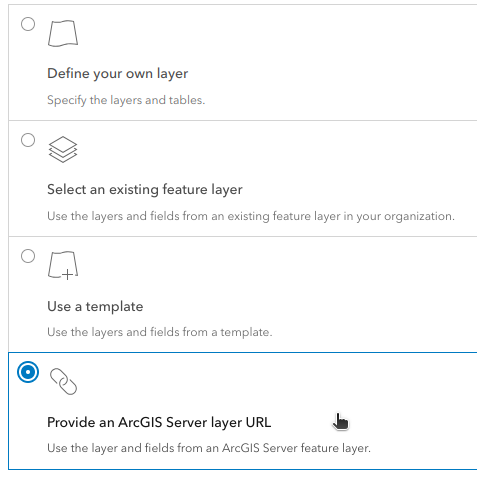
Select Provide an ArcGIS Server layer URL out of the 4 choices
Enter the URL of the RestAPI for the ncWMS Demo Datasource:
https://hub.hereon.de/server/rest/services/Hosted/ncWMS_Demo_Datasource/FeatureServer
Now give it a suitable name, keywords, description, etc. and you are done.
Creating a compatible DataSource with the DASF Experience Builder Plugin
To create a Datasource that can be dynamically populated by the DASF Experience Builder Plugin, use it’s possibility to upload a datasource config. Click your DASF Experience Builder Plugin in the Experience Builder and in the settings UI:
Expand the Add new datasource section in the Output datasources section
Upload the following config:
dasf-datasource-config.jsonEdit the name of the datasource
Now you can populate it from your DASF backend module.
Datasource Spec
The columns of the feature layer define the ncWMS widget. They can populate the widget with WMS services, or provide default visualization settings or dimension settings. Each row is treated sequentially. Only the WMS Service specific columns are added up, for the other columns we have the rule that rows down below overwrite rows above with the same grouper.
Note that all columns are optional, and you can load multiple data sources at once in the widget. As such, you can use this framework to define default visualization settings, etc.
General columns
There is one general column, namely
- grouper
When empty, the visualization and dimension settings defined by this record are applied to all WMS Configs. Otherwise this grouper should be the name of a WMS Config that this row applies to (except for url and label)
WMS Service columns
The following two columns can be used to add a new WMS Service to the WMS Config defined via the grouper column. If the grouper column is empty, a new WMS Config labeled unnamed will be created.
The url and label columns fill up, i.e. each url and label will become a separate tab for the given WMS Config.
- label
The label determines the name of the tab for the service. If the WMS config has only one single service, there will be no tabs and the label does not have any effect.
- url
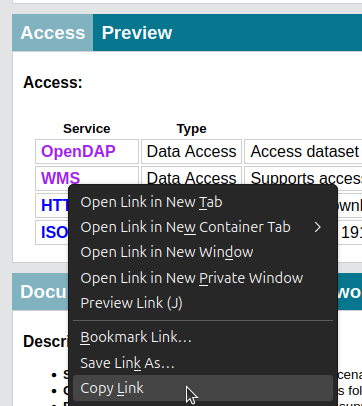
The URL of the service is the so-called
GetCapabilitiesprovided by your ncWMS-Server. If your using a THREDDS-Server (this one here for instance), you can get this by copying the URL of the WMS-Link in the Access-Section of your netCDF file
Dimension columns
The dimension columns specify what variable, what service and what time step is specified.
- selectedservice
The label of the service to show in the beginning. If a service does not have a label, use the url instead
- variablename
The variable to visualize. If not set, it will be defined by the ncWMS server
- variablelabel
The label of the variable to visualize. If not set, it will default to the variablename (or defined by the ncWMS Server if the latter is empty)
- selectedyear
The year of the time step to show in the beginning
- selectedmonth
The month of the time step to show in the beginning
- selectedday
The day of the time step to show in the beginning
- selectedtime
The timestamp of the time step to show in the beginning
- zvalue
The vertical level to show in the beginning
Visualization columns
The visualization parameters are mostly defined through the custom parameters to ncWMSs GetMap request.
- visualizationstyle
The visualization style for the ncWMS request. Common once are
default-scalar,colored_contours,contoursandraster- colorbands
The number of discrete colours to plot the data. Must be between 2 and 250 (
NUMCOLORBANDS)- mincolor
The minimum of the
COLORSCALERANGEused for plotting the data- maxcolor
The minimum of the
COLORSCALERANGEused for plotting the data- palette
The palette used for visualization (see the
STYLESparameter)- logscale
1(true) or0(false) - whether to plot data with a logarithmic scale (`LOGSCALE)- opacity
The opacity for the layer added to the map
- belowmincolor
The colour to plot values which are below the minimum end of the scale range. Colours are as defined in the GetMap Docs, with the addition of “extend”, which will use the minimum value of the palette. (
BELOWMINCOLOR)- abovemaxcolor
The colour to plot values which are above the maximum end of the scale range. Colours are as defined in the GetMap Docs, with the addition of “extend”, which will use the maximum value of the palette. (
ABOVEMAXCOLOR)- nodatacolor
The colour to plot missing values (
NaN). Colours are as defined in the GetMap Docs, with the addition of “extend”, which will use the maximum value of the palette. (BGCOLOR)
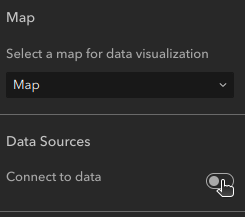
Connecting to a datasource
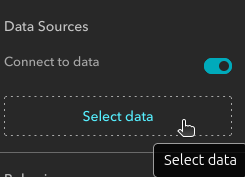
To connect to a data source, created as described above, click the ncWMS widget in the experience builder and toggle the Connect to data switch in the Data Sources section
Once enabled, you will see a Select data button.
Once clicked, another sidebar pops up where you can choose the data. If you don’t see any data source, click the Add new data button at the bottom and in the upcoming window, you should be able to select Layers in the left sidebar where you then find your layer you created above. Select it and click Done.
Now you can select the data source and it will be used to populate the widget.