Quickstart
Create a new experience builder app and add an ncWMS widget to it via
drag-n-drop. It will come with some preconfigured WMS services that you are
generated from the default config.json file.
To visualize these services, add one of ESRIs Map widgets to your app, click
the ncWMS widget and in the settings view, select the created map
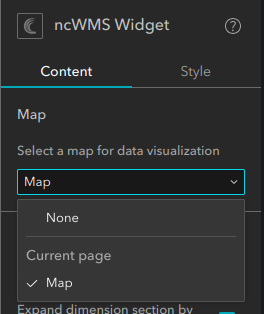
The widget now visualizes the first service on the map.
Widget layout
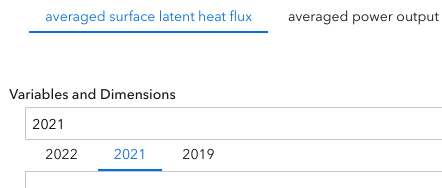
The widget is designed such that it supports multiple so-called WMS Configs, and each WMS Config can have multiple WMS Services. It is common, for instance, that a climate model output is split up into yearly files and each file contains one variable. This is how our default config is setup. Here you would now add one WMS Config per variable and one WMS Service per year (file).
The user of the widget is then faced with one tab per variable and, below that, one tab per year
Note
Each service for one WMS Config should contain the same variables and vertical dimensions. It should only differ in the temporal dimension! If your services differ in their variables, consider creating one WMS Config per service.
Each WMS Config tab is then populated with two collapsible sections, one for choosing the service to visualize (aka the netCDF file), the variable, time step and vertical dimension. The second collapsible section is for modifying the visualization using the palettes and styles provided by the ncWMS (aka thredds)-server.